The DevTools docs have moved! Read the latest version of this article and head over to the new home of Chrome DevTools for the latest tutorials, docs and updates.
Profiling memory performance
This tutorial explains how to use the Heap Profiler for uncovering memory leaks in your applications.
Read the Memory 101 page to become familiar with the terms used in this document.
Note: If you are a Web Developer and want to get the latest version of Developer Tools, you should use the Google Chrome release from the Developer Channel.
Basic functions
Taking a snapshot
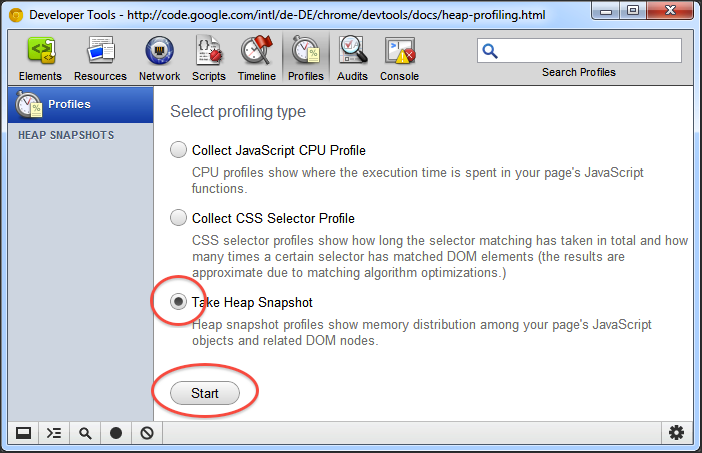
On the Profiles tab, select the Take Heap Snapshot option and press Start:
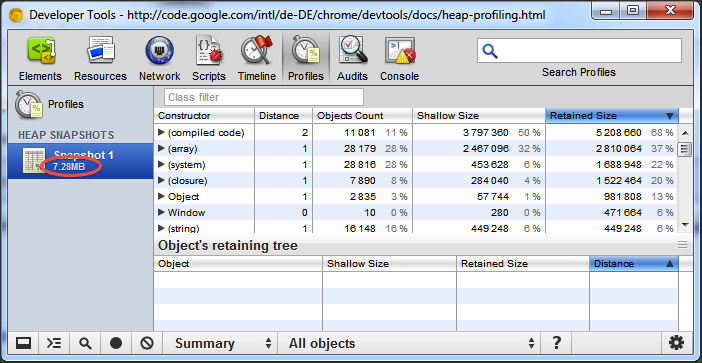
Snapshots are initially stored in the renderer process memory. They are transferred to the DevTools on demand, when you click on the snapshot icon to view it. After the snapshot has been loaded into DevTools and has been parsed, the number below the snapshot title appears and shows the total size of the reachable JavaScript objects:
Clearing snapshots
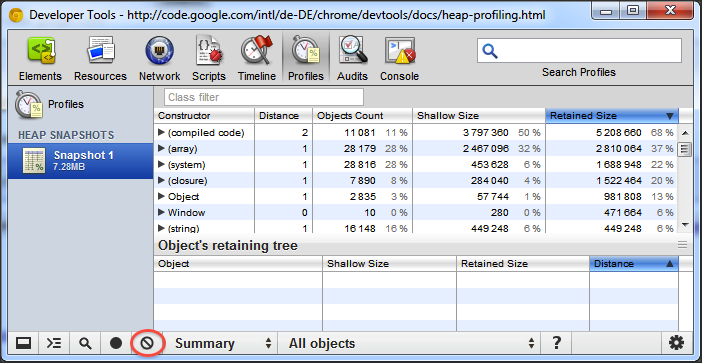
Snapshots can be removed (both from DevTools and renderer's memory) by pressing the Clear all profiles button:
Note: Closing the DevTools window will not delete collected profiles from the renderer's memory. When reopening DevTools, all previously taken snapshots will reappear in the list of snapshots.
Switching between snapshot views
A snapshot can be viewed from different perspectives for different tasks. To switch between views, use the selector at the bottom of the view:
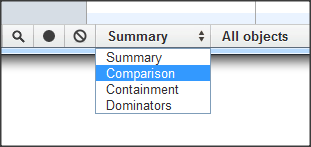
There are four views:
- Summary — shows objects grouped by the constructor name;
- Comparison — displays difference between two snapshots;
- Containment — allows exploration of heap contents;
- Dominators — shows dominators tree.
Looking up color coding
Properties and property values of objects have different types and are colored accordingly. To view the type color legend, press the question mark button on the status bar:
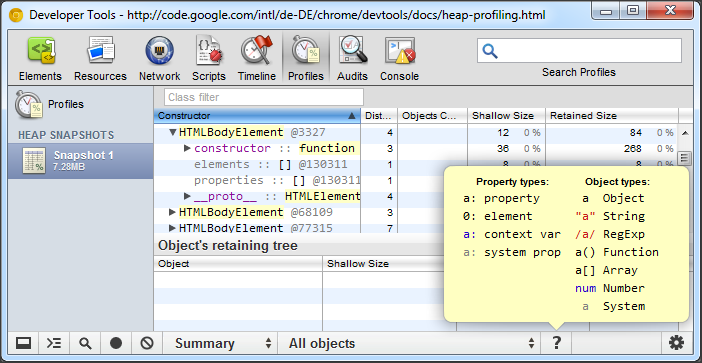
Each property has one of four types::
- property — a regular property with a name,
accessed via the
.(dot) operator, or via[](brackets) notation, e.g.["foo bar"]; - element — a regular property with a numeric
index, accessed via
[](brackets) notation; - context variable — a variable in a function context, accessible by its name from inside a function closure;
- system property — property added by the JavaScript VM, not accessible from JavaScript code.
Objects designated as System don't have corresponding JavaScript types. They are part of JavaScript VM's object system implementation.
Views in detail
Summary view
Initially, a snapshot opens in the Summary view, displaying object totals, which can be expanded to show instances:
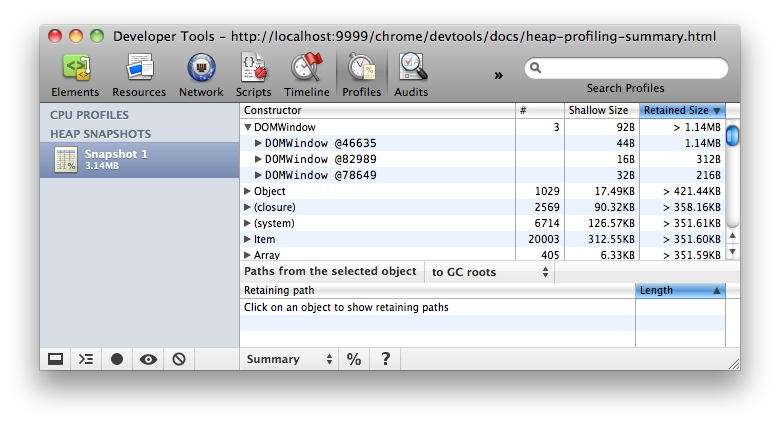
Top-level entries are "total" lines. They display the constructor name, and group all objects created using this constructor. The number of object instances is displayed in the # column. The Shallow size column displays the sum of shallow sizes of all objects created by a certain constructor function. The Retained Size column displays the maximum retained size among the same set of objects.
After expanding a total line in the upper view, all of its instances are displayed. For each instance, its shallow and retained sizes are displayed in the corresponding columns. The number after the @ character is the object unique ID, allowing to compare heap snapshots on per-object basis.
Try this demo page (opens in a new tab) to understand how the Summary view can be used.
Comparison view
When more than one heap snapshot is taken, it is possible to compare them, and find leaked objects. To verify that a certain application operation doesn't create leaks (e.g. usually a pair of direct and reverse operations, like opening a document, and then closing it, should not leave any garbage), you may follow the scenario below:
- take a heap snapshot before performing an operation;
- perform an operation (e.g. open a document);
- perform a reverse operation (close the document);
- take a heap snapshot.
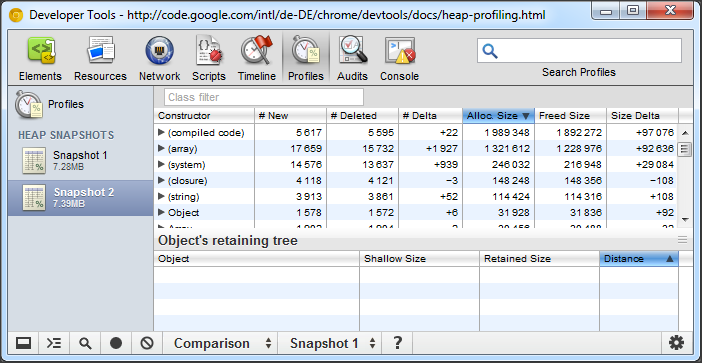
In the Comparison view, the difference between two snapshots is displayed. When expanding a total entry, added and deleted object instances are shown:
Try this demo page (opens in a new tab) to get an idea how to use snapshot comparison for detecting leaks.
Containment view
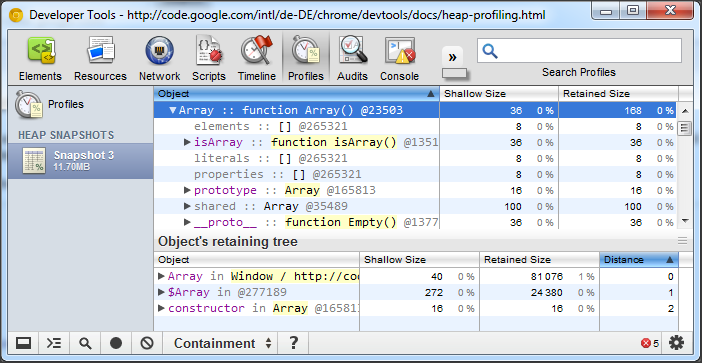
The Containment view is essentially a "bird's eye view" of your application's objects structure. It allows you to peek inside function closures, to observe VM internal objects that together make up your JavaScript objects, and to understand how much memory your application uses at a very low level.
The view provides several entry points:
DOMWindowobjects — these are objects considered as "global" objects for JavaScript code;- GC roots — actual GC roots used by VM's garbage collector;
- Native objects — browser objects that are "pushed" inside the JavaScript virtual machine to allow automation, e.g. DOM nodes, CSS rules (see the next section for more details.)
Below is the example of what the Containment view looks like:
Try this demo page (opens in a new tab) for finding out how to explore closures and event handlers using the view.
Uncovering DOM leaks
The unique ability of the new tool is to reflect bidirectional dependencies between browser native objects (DOM nodes, CSS rules) and JavaScript objects. This helps to discover otherwise invisible leaks happening due to forgotten detached DOM subtrees floating around.
Native objects are most easily accessible from Summary and Containment views — there are dedicated entry nodes for them:
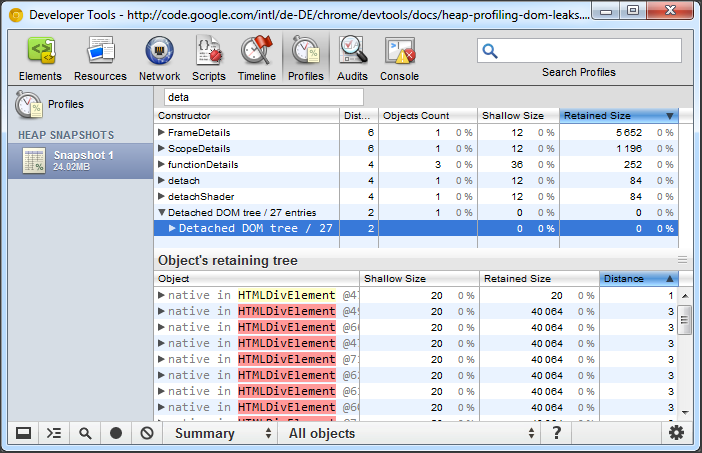
Try this demo page (opens in a new tab) to play with detached DOM trees.
Dominators view
The Dominators view shows the dominators tree for the heap graph. The Dominators view looks similar to the Containment view, but lacks property names. This is because a dominator of an object may lack direct references to it, that is, the dominators tree is not a spanning tree of the graph. But this only serves for good, as helps us to identify memory accumulation points quickly.
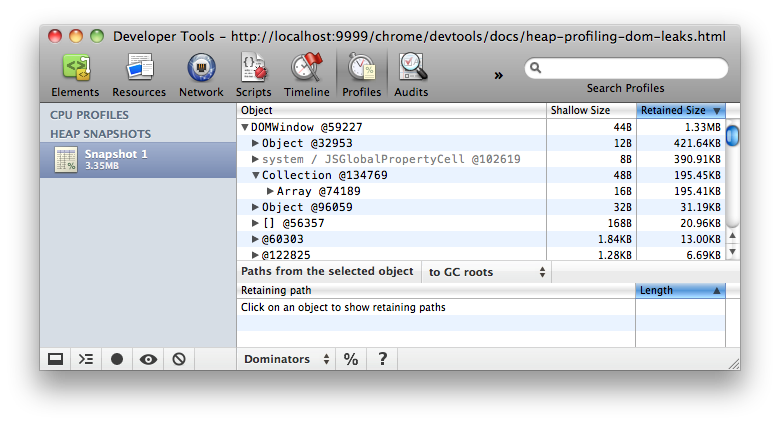
Try this demo page (opens in a new tab) to train yourself in finding accumulation points.
Retaining paths
The retaining paths view is always displayed. To activate it, click on an
object in the upper pane, regardless of what view is currently active. The
profiler will start looking up for simple paths from roots to the object
selected. It will start from shorter paths, gradually increasing walking
distance. It is possible to restrict the roots set to DOMWindow
objects, instead of all GC roots. This is helpful for finding references
originating from the application itself — they are the most probable
sources for leaks:

In the simplest case, the path will only include "true" JavaScript objects and use references that are accessible from JavaScript code, e.g.:
DOMWindow@1234.foo.barDOMWindow@1235.listeners[34].handler["on click event"]
Such paths can be easily evaluated in the debugger console if the appropriate context has been entered. For example, if an application has several iframes, execution must be suspended during running a function code belonging to it). Evaluating a path makes it possible to examine the complete contents of each object, including properties whose values not stored in the heap, and thus not captured in a snapshot.
Often it happens that an object is retained via closures. Closure references
are displayed using the -> notation:
DOMWindow@1234.callbacks[12]->contextDOMWindow@1235.callback->nested->inside
Even more advanced are paths including "hidden"
objects. Normally, the existence of such paths doesn't mean that an
application has a leak. Some of the paths are "low level"
paths, equivalent to their JavaScript shortcuts. E.g., every object
has elements and properties internal arrays,
thus a property value can be displayed as held directly by an object
(this is how a JavaScript programmer sees it), or as an element of the
properties array (this is how the JavaScript virtual machine
actually accesses it.) Knowing these details might help in getting an
understanding of how the virtual machine works. However, for most of web
application developers it is safe to ignore them. Below are some examples of
"internal" paths:
GCRoots@1[254]DOMWindow@1234{prop}{1}— this is equivalent to a JavaScript path:DOMWindow@1234.propDOMWindow@1235.object{properties}{2}
Q&A
- I don't see all the properties of objects, I don't see non-string values for them! Why?
- Not all properties are actually stored on the JavaScript heap. Some of them are implemented using getters that execute native code. Such properties are not captured in heap snapshots in order to avoid the cost of calling getters and to avoid possible program state changes if getters are not "pure" functions. Also, non-string values such as numbers are not captured in an attempt to reduce snapshot size.
- What does the number after
the
@char mean — is this an address or an ID? Is the ID value really unique? - This is an object ID. Displaying an object's address makes no sense, as objects are moved during garbage collections. Those object IDs are real IDs — that means, they persist among multiple snapshots taken. This allows precise comparison between heap states. Maintaining those IDs adds an overhead to GC cycles, but it is only initiated after the first heap snapshot was taken — no overhead if heap profiles aren't used.
- Are "dead" (unreachable) objects included in snapshots?
- No. Only reachable objects are included in snapshots. Also, taking a snapshot always starts with doing a GC.
- What comprises GC roots?
- Many things:
- built-in object maps;
- symbol table;
- stacks of VM threads;
- compilation cache;
- handle scopes;
- global handles.
