Chrome DevTools Overview
The Chrome Developer Tools (DevTools), are a set of web authoring and debugging tools built into Google Chrome. The DevTools provide web developers deep access into the internals of the browser and their web application. Use the DevTools to efficiently track down layout issues, set JavaScript breakpoints, and get insights for code optimization.
The DevTools docs have moved! For the latest tutorials, docs and updates head over to the new home of Chrome DevTools.
Accessing the DevTools
To access the DevTools, open a web page or web app in Google Chrome. Either:
- Select the Chrome menu
 at the top-right of your browser window, then select Tools > Developer Tools.
 - Right-click on any page element and select Inspect Element.
The DevTools window will open at the bottom of your Chrome browser.
There are several useful shortcuts for opening the DevTools:
- Use Ctrl+Shift+I (or Cmd+Opt+I on Mac) to open the DevTools.
- Use Ctrl+Shift+J (or Cmd+Opt+J on Mac) to open the DevTools and bring focus to the Console.
- Use Ctrl+Shift+C (or Cmd+Shift+C on Mac) to open the DevTools in Inspect Element mode, or toggle Inspect Element mode if the DevTools are already open.
For your day-to-day workflow, learning the shortcuts will save you time.
The DevTools window
The DevTools are organised into task-oriented groups in the toolbar at the top of the window. Each toolbar item and corresponding panel let you work with a specific type of page or app information, including DOM elements, resources, and sources.
Overall, there are eight main groups of tools available view Developer Tools:
You can use the Ctrl+[ and Ctrl+] shortcuts to move between panels.
Inspecting the DOM and styles
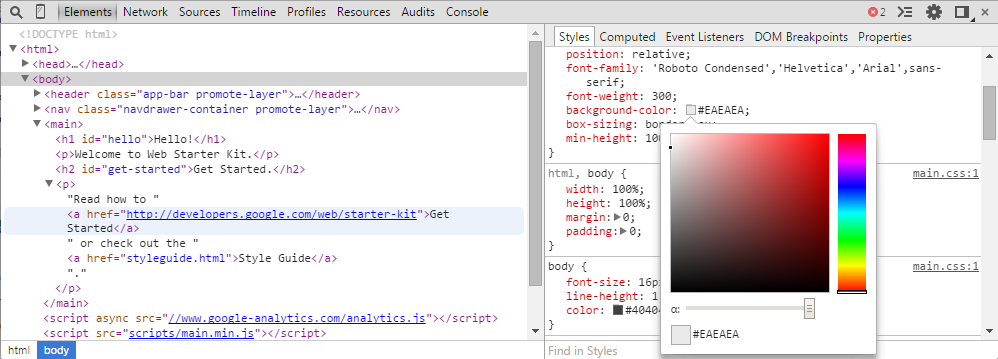
The Elements panel lets you see everything in one DOM tree, and allows inspection and on-the-fly editing of DOM elements. You will often visit the Elements tabs when you need to identify the HTML snippet for some aspect of the page. For example, you may be curious if an image has an HTML id attribute and what the value is.
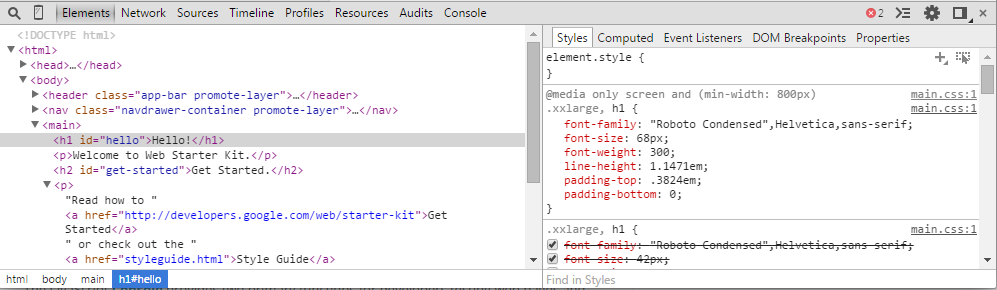
Read more about inspecting the DOM and styles
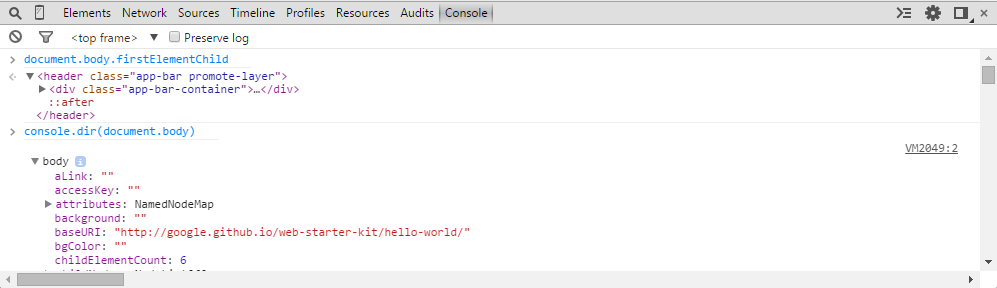
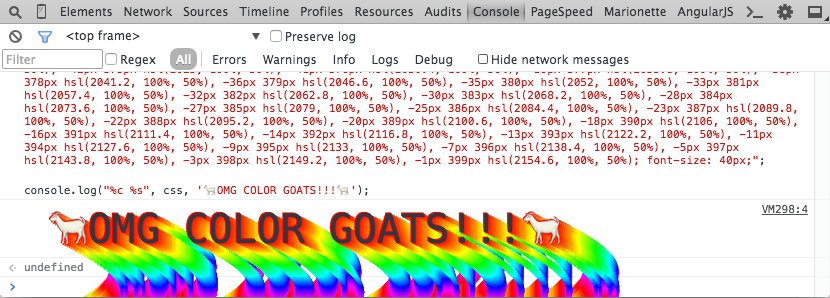
Working with the Console
The JavaScript Console provides two primary functions for developers testing web pages and applications. It is a place to:
- Log diagnostic information in the development process.
- A shell prompt which can be used to interact with the document and DevTools.
You may log diagnostic information using methods provided by the Console API. Such as console.log() or console.profile().
You can evaluate expressions directly in the console and use the methods provided by the Command Line API. These include $() command for selecting elements or profile() to start the CPU profiler.
Read more about working with the console
Debugging JavaScript
As the complexity of JavaScript applications increase, developers need powerful debugging tools to help quickly discover the cause of an issue and fix it efficiently. The Chrome DevTools include a number of useful tools to help make debugging JavaScript less painful.
Read more about how to debug JavaScript with the DevTools »
Improving network performance
The Network panel provides insights into resources that are requested and downloaded over the network in real time. Identifying and addressing those requests taking longer than expected is an essential step in optimizing your page.
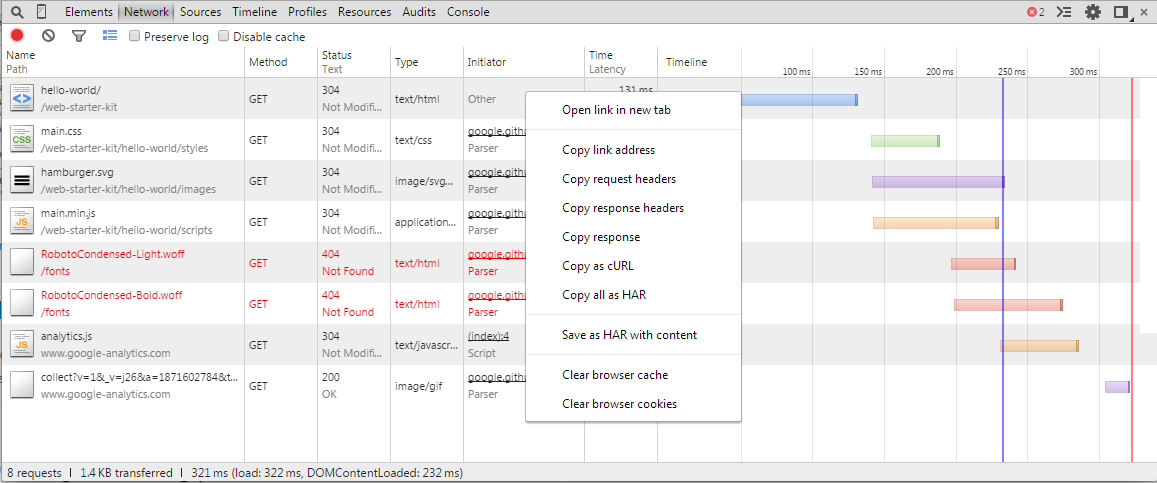
Read more about how to improve your network performance »
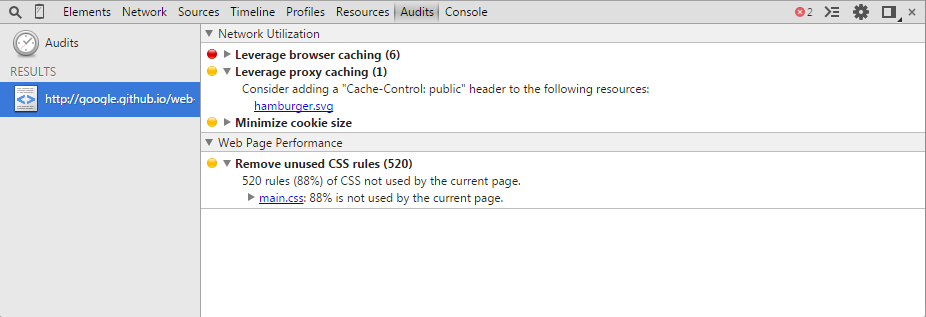
Audits
The Audit panel can analyze a page as it loads. Then provides suggestions and optimizations for decreasing page load time and increase perceived (and real) responsiveness. For further insight, we recommend using PageSpeed Insights.
Improving rendering performance
The Timeline panel gives you a complete overview of where time is spent when loading and using your web app or page. All events, from loading resources to parsing JavaScript, calculating styles, and repainting are plotted on a timeline.
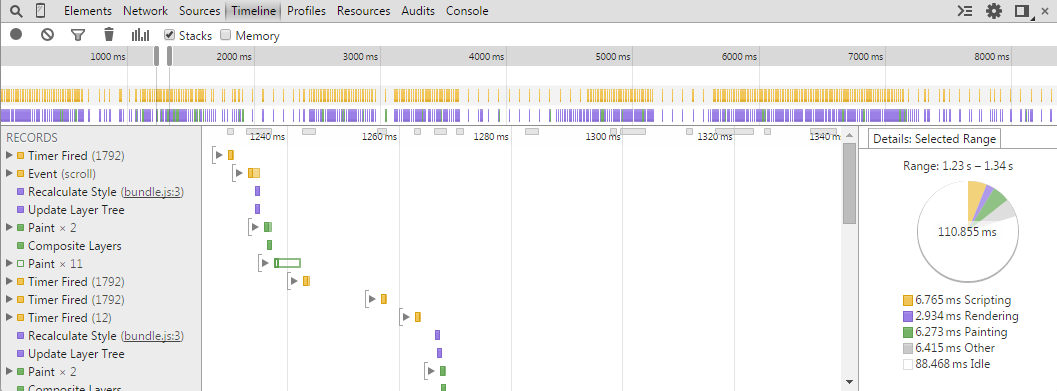
Read more about how to improve rendering performance »
JavaScript & CSS performance
The Profiles panel lets you profile the execution time and memory usage of a web app or page. These help you to understand where resources are being spent, and so help you to optimize your code. The provided profilers are:
- The CPU profiler shows where execution time is spent in your page's JavaScript functions.
- The Heap profiler shows memory distribution by your page's JavaScript objects and related DOM nodes.
- The JavaScript profile shows where execution time is spent in your scripts
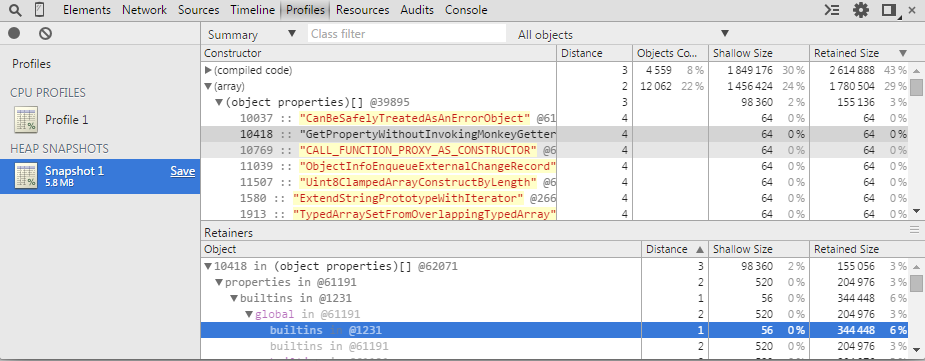
Read more about using how to improve JavaScript and CSS performance »
Inspecting storage
The Resources panel lets you inspect resources that are loaded in the inspected page. It lets you interact with HTML5 Database, Local Storage, Cookies, AppCache, etc.
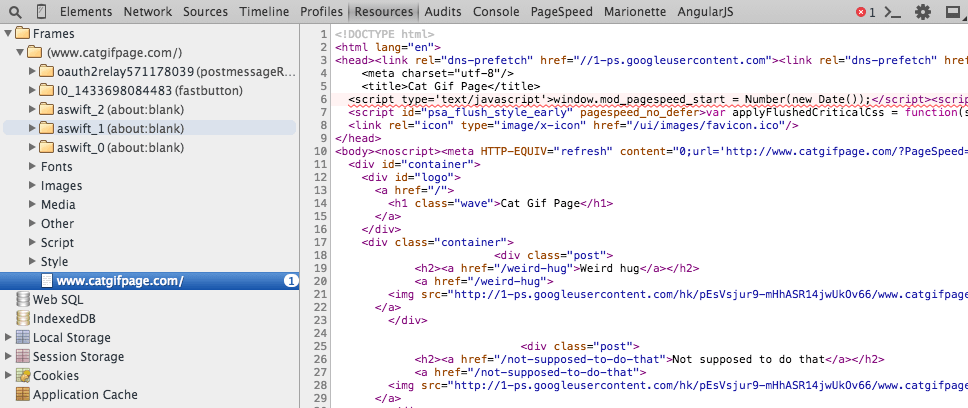
Read more about inspecting storage resources »
Further reading
There are several other areas of the DevTools documentation that you might find beneficial to review. These include:
Further resources
Get more
You can also follow us on @ChromiumDev or ask a question using the forums.
Be sure to checkout the Google Chrome Developers page on Google+.
Get involved
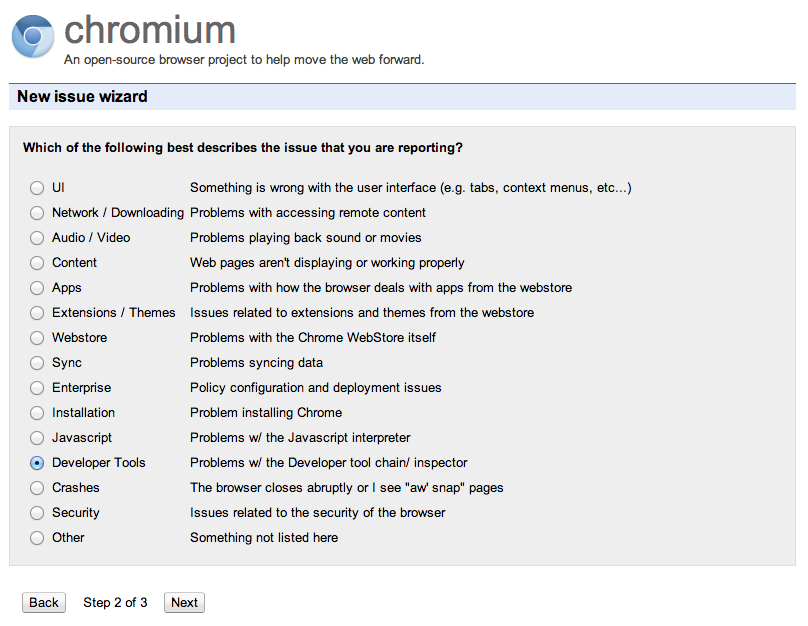
To submit a bug or a feature request on DevTools, please use issue tracker at http://crbug.com. Please also mention "DevTools" in the bug summary.
Anyone can also help make the DevTools better by directly contributing back to the source.
Debugging Extensions
Looking to use the DevTools to debug Chrome extensions? Watch Developing and Debugging extensions. A Debugging tutorial is also available.